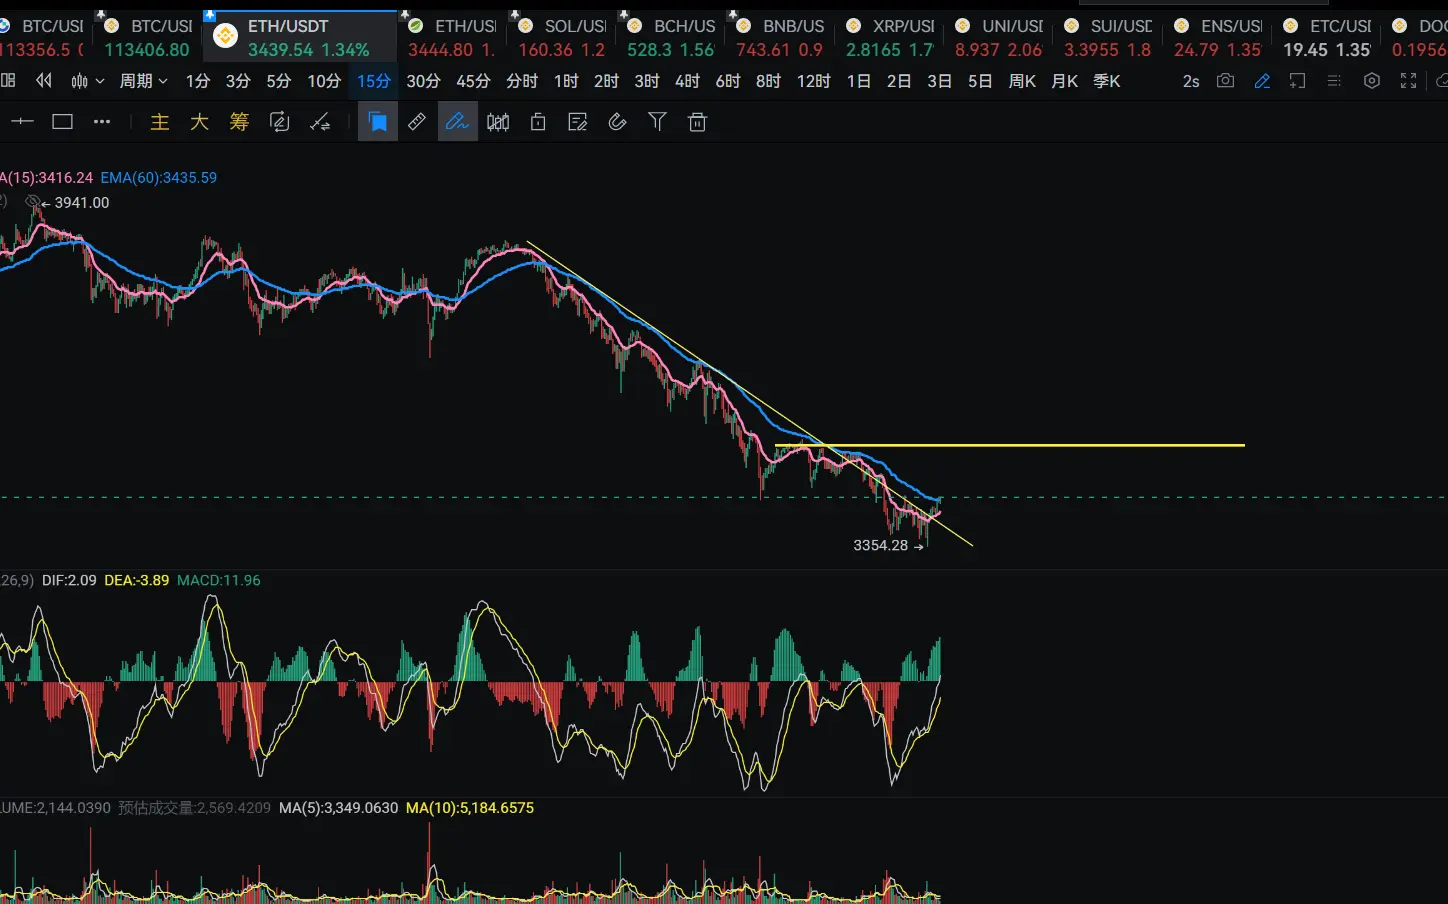
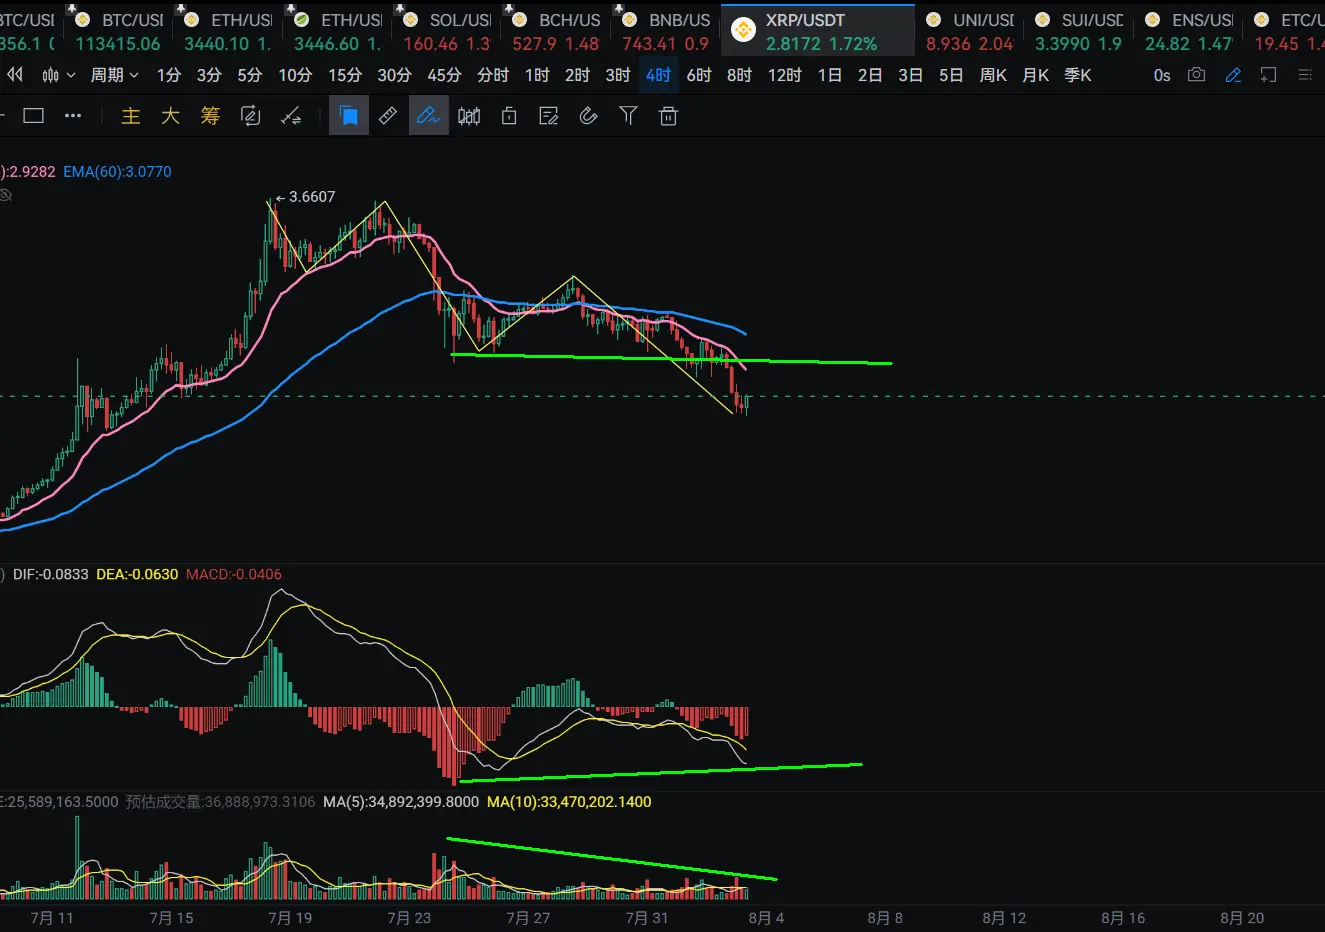
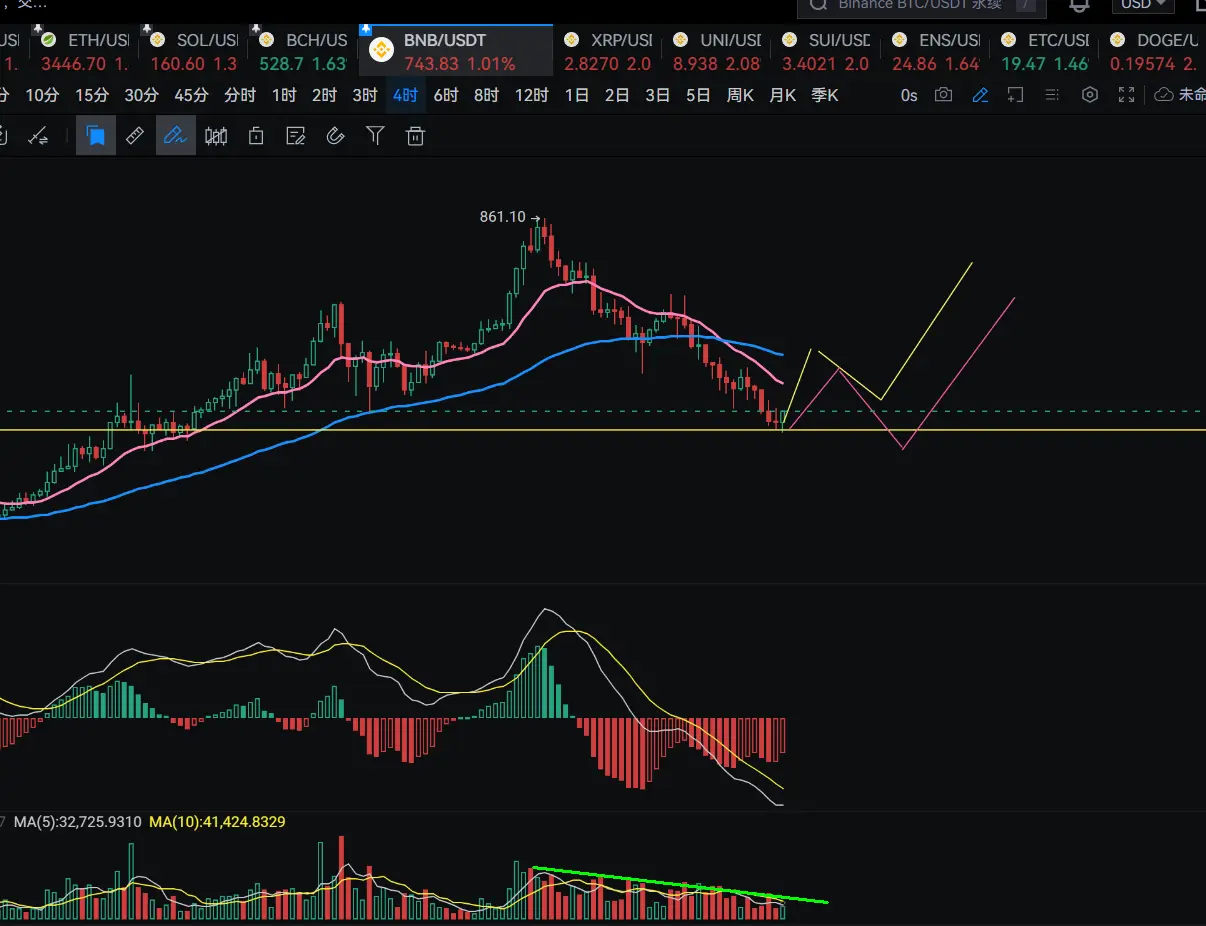
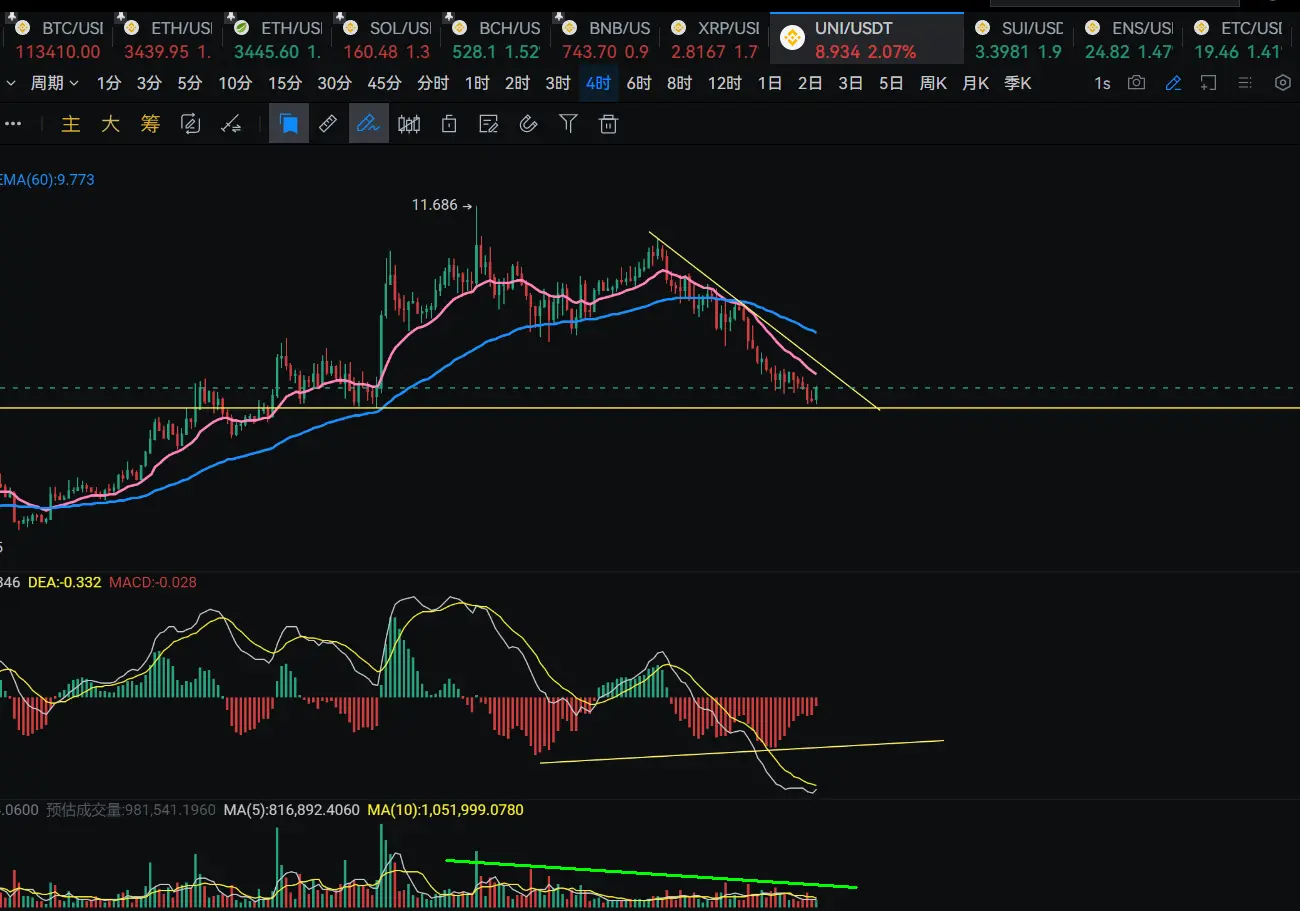
TrendBreaker_BigFishB

vip
Trading Bots
Block This User
TrendBreaker_BigFishB
vip
$BTC
Weekly K: Entering a sideways consolidation, false breakouts are the most obvious risk, and the bullish momentum is weakening. There are three possible outcomes this time, all of which will affect the short-term trend and have a relatively large amplitude.
① The weekly K-turn will be a cash machine for the bears, while also being a nightmare for the bulls.
② Entering a sideways consolidation on the weekly K chart, the next cycle will show a clear downward trend, and the subsequent cycles will repeatedly exhibit a pattern of downward consolidation followed by a decline.
If it continues to
View Original
  • Reward
  • Comment
  • Share
TrendBreaker_BigFishB
vip
#BTC#
$BTC View: Continuing to decline
$ETH View: Continuing to Decline
$SOL View: Continuing to Decline
View Original
  • Reward
  • Comment
  • Share
TrendBreaker_BigFishB
vip
#PI#
$BTC
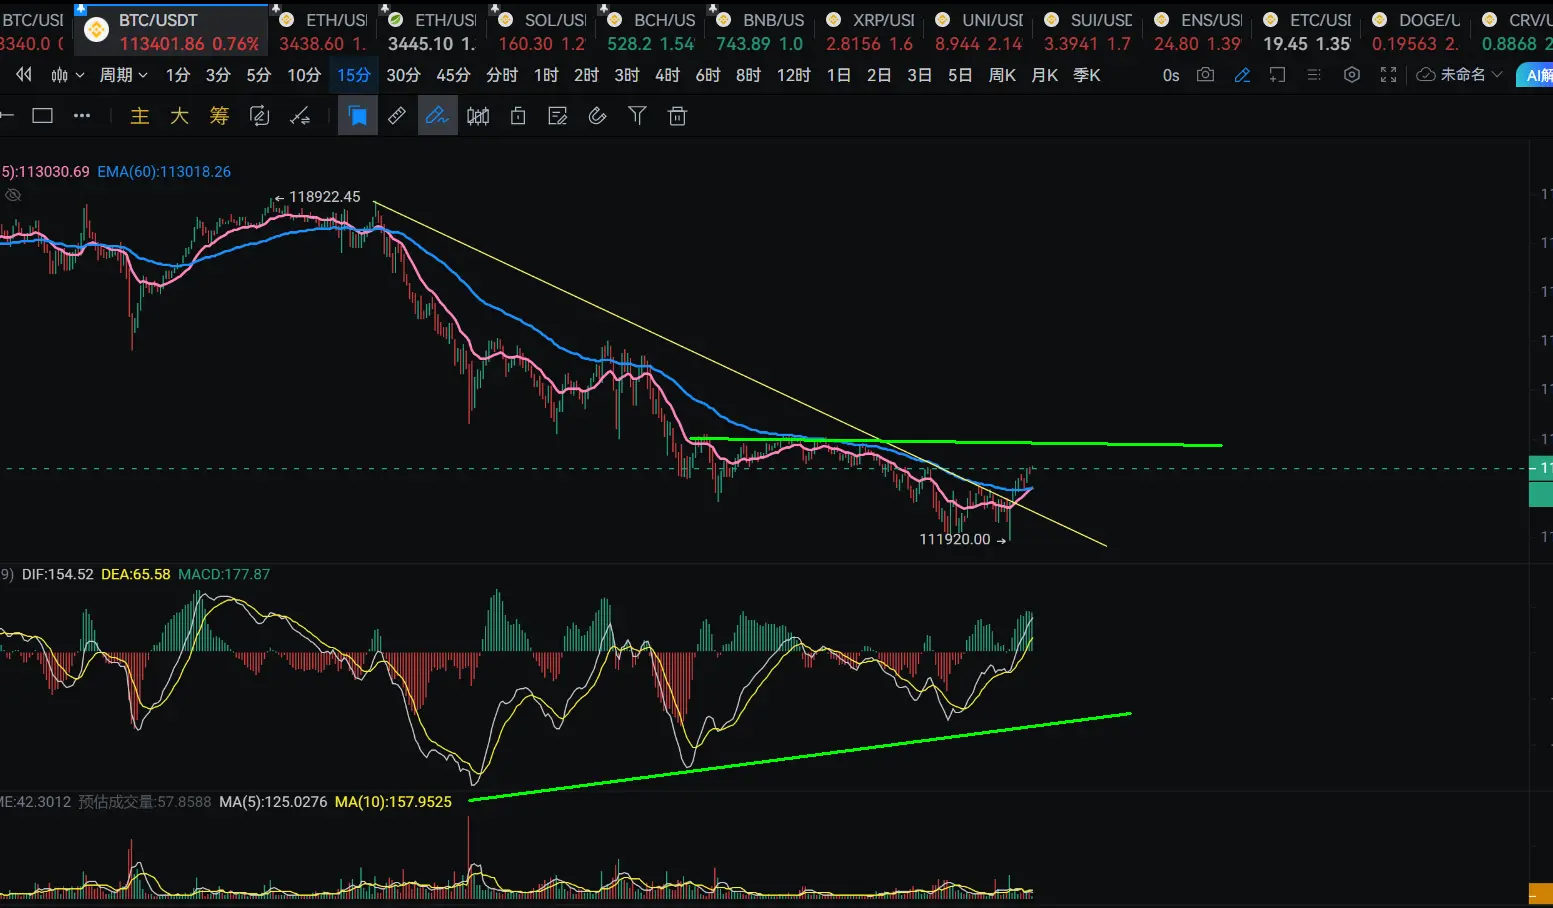
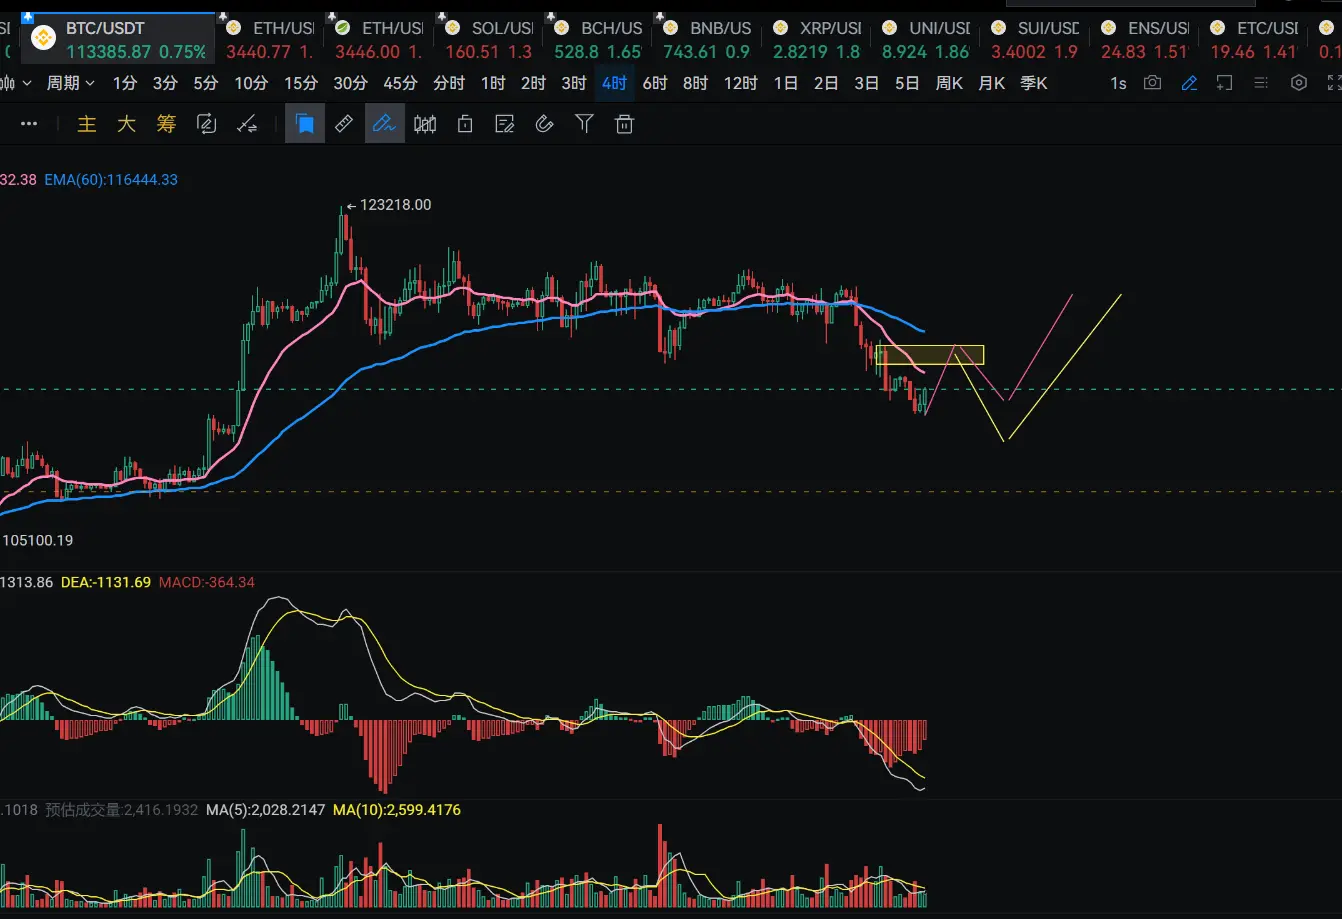
The 4-hour chart is currently consolidating between 102,000 and 110,000. It has now broken below the trend line and the neckline. Key resistance is around 106,600. If this level cannot be breached, it will form a triple top sell signal. Caution is advised.
The morning reminder is that 104500 has support and will bounce back. As expected, did you eat meat? #BTC#
View Original
post-image
post-image
  • Reward
  • 4
  • Share
TrendBreaker_BigFishBvip:
So there are so-called bulls and bears, and a falling trend. Just short near the resistance level, that's enough. No need to think too much.
View More
TrendBreaker_BigFishB
vip
#BTC#
$BTC view
Three consecutive bearish candlesticks on the daily chart, with each body larger than the last, indicate strong downward momentum for the bears and also suggest a trend towards new lows.
At present, it is still in the sideways area for 4 hours, but the trend line has been broken, and the neckline of 106600 has also been broken, but the key neckline is near 102600, and the direction of breaking below this position will continue to fall
Short-term support at 104500 will see a rebound; after the rebound, just focus on where to short.
It has been warning about risks at 110,000, ind
View Original
post-image
post-image
post-image
  • Reward
  • 10
  • Share
Mfyzltvip:
Just go for it💪Just go for it💪Just go for it💪
View More
TrendBreaker_BigFishB
vip
#ETH# The previous high has been broken through, with a significant Bullish line, the 4-hour MACD is on the verge of death, fighting pattern, continue to hold bullish.
Details: The left high point range has already broken through and cannot fall back. It can spike, but it must immediately recover. The price will continue to rise, with a target around 2850.
View Original
post-image
  • Reward
  • Comment
  • Share
TrendBreaker_BigFishB
vip
#Bitcoin 2025 Conference
$BTC opinion
4H range-bound oscillation
1 hour rebound a transaction
15-minute up and down structure, focus on strength, pressure 109200
$ETH view
Low long, watch for the breakout, resistance at 2850, pay attention to whether it can break through effectively. If a small-level top divergence appears after the breakout, there is a possibility of a false breakout, and the price may fall back after the breakout. Pay attention to the details.
The risk of a major downward cycle for BTC has not been eliminated.
View Original
post-image
  • Reward
  • Comment
  • Share
TrendBreaker_BigFishB
vip
Points? Strategies? Methods require a fee?
Need a hammer!
Just register through the Dayu Haitang link, and the benefits keep increasing. This is how you win big.
1. Save on transaction fees
2. Technical Learning
3. Opinion sharing, entry points for long and short positions
4. Short, medium, and long contracts are executed simultaneously.
📌If you need a welfare strategy, please recognize 'Dayu Haitang', feel free to chat.
View Original
  • Reward
  • 1
  • Share
GateUser-99271057vip:
How to chat?
TrendBreaker_BigFishB
vip
#ETH#
$ETH perspective
The 4-hour high point has not shown signs of exhaustion; it is currently in a sideways trend. The resistance level is 2730, and there is a head and shoulders bottom pattern on the 30-minute chart, with the neckline at 2580 already broken. Attention should be paid to whether the 2730 resistance can be broken; if it breaks, there is a chance to reach a new high around 2850.
Note: BTC perspective, maintain a bearish outlook, expecting a reversal or significant pullback on the daily chart. Once BTC reverses in the future, other assets can be expected to follow.
View Original
post-image
  • Reward
  • 2
  • Share
ConfusedBoyvip:
can
View More
TrendBreaker_BigFishB
vip
#BTC#
$BTC maintains the same view. Cautiously look for low buy opportunities and seek short opportunities at high levels, as there may be a chance to capture a historical turning point.
Other assets follow BTC. The current risk in the cryptocurrency market does not stem from the assets themselves, but rather from BTC.
From a structural perspective, both BTC and ETH have the expectation of reaching new highs again. A new high for BTC would provide a better opportunity for short positions! Be patient and wait for the integrity of the structure and the appearance of key reversal signals.
Today's
View Original
  • Reward
  • 3
  • Share
GateUser-2c9d8f52vip:
This analysis is much more reliable than some people's. grat 👍👍
View More
TrendBreaker_BigFishB
vip
#BTC#
The view on $BTC remains to take long positions and realize profits in a timely manner, exit from spot trading, and short at highs, regardless of whether there is a breakout or not.
ETH outlook, first the big pie weakens, the highs are decreasing, hovering near the major line on the 4-hour chart, MACD is below the 0 line, and the bias is bearish below 30 minutes.
$LINK Slightly Bearish
$SOL bearish
$LTC bearish
Many assets have already gone short ahead of Bitcoin.
㊗️Good luck to the bulls, take care, take care
View Original
  • Reward
  • Comment
  • Share
TrendBreaker_BigFishB
vip
#BTC# Rebound has arrived as scheduled, continue to wait for opportunities. Yesterday emphasized on buying low, did you keep up?
View Original
post-image
post-image
post-image
  • Reward
  • Comment
  • Share
TrendBreaker_BigFishB
vip
#BTC#
The rebound after the first drop in 30 minutes came as expected.
Pay attention to the strength and exhaustion above the central level when looking for short-selling points.
View Original
post-image
post-image
post-image
post-image
post-image
  • Reward
  • 2
  • Share
CryptoLoverArtistvip:
love ur chat background
View More
TrendBreaker_BigFishB
vip
#BTC#
$BTC Viewpoint
The daily chart shows an upward trend (, but the bullish momentum is waning ), which may lead to risks in the daily line in the future.
In 4 hours, a new high point has been reached, with divergence in both the MACD yellow and white lines and the momentum bars, currently hovering at a high position.
In a period of less than 30 minutes, if it oscillates within the triangle after the breakout, it needs to be verified whether it is a continuation pattern for an upward trend.
Trading details: Consider entering a long position at the triangle breakout slope line and horizontal
View Original
post-image
post-image
post-image
post-image
  • Reward
  • Comment
  • Share
TrendBreaker_BigFishB
vip
#BTC# #BTC突破107,000美元#
The point is: if it breaks a new high, just let it break. If it breaks and then drops back to 109580, go short directly. The MACD pattern on the daily chart indicates that a waterfall could happen at any time.
First, pay attention to the support levels of 103500, 103000, and 102700. There is a possibility of rebounding to a new high here, and the likelihood of a direct drop below needs to be observed in the candlestick chart.
Additionally: If it falls below 103000 in the future, the price will reach below 100000.
Ethereum and SOL's 4-hour moving averages are converging. O
View Original
post-image
post-image
post-image
post-image
  • Reward
  • 4
  • Share
CorruptionAuevip:
well… I still need to study more more and more than just staking, I’m bad as bruh
View More
TrendBreaker_BigFishB
vip
$BTC $ETH
Today's Perspective:
The short-term outlook for BTC remains bullish, but the daily chart has entered a risk zone. We cannot rule out a last-minute rally, as it is only 2,000 points away from the previous high. I have already closed all my medium and short-term long positions and cleared my spot holdings.
Trading Idea: There are risks, but that doesn’t mean we should open long-term short positions now; the conditions are not mature. Going long is following the trend, but the risks are already present, and when they will manifest is not for us to decide. We need to maintain a risk-awa
View Original
  • Reward
  • Comment
  • Share
Trade Crypto Anywhere Anytime
qrCode
Scan to download Gate app
Community
English
  • 简体中文
  • English
  • Tiếng Việt
  • 繁體中文
  • Español
  • Русский
  • Français (Afrique)
  • Português (Portugal)
  • Bahasa Indonesia
  • 日本語
  • بالعربية
  • Українська
  • Português (Brasil)